Data Analysis: Fullstack Intensive Bootcamp
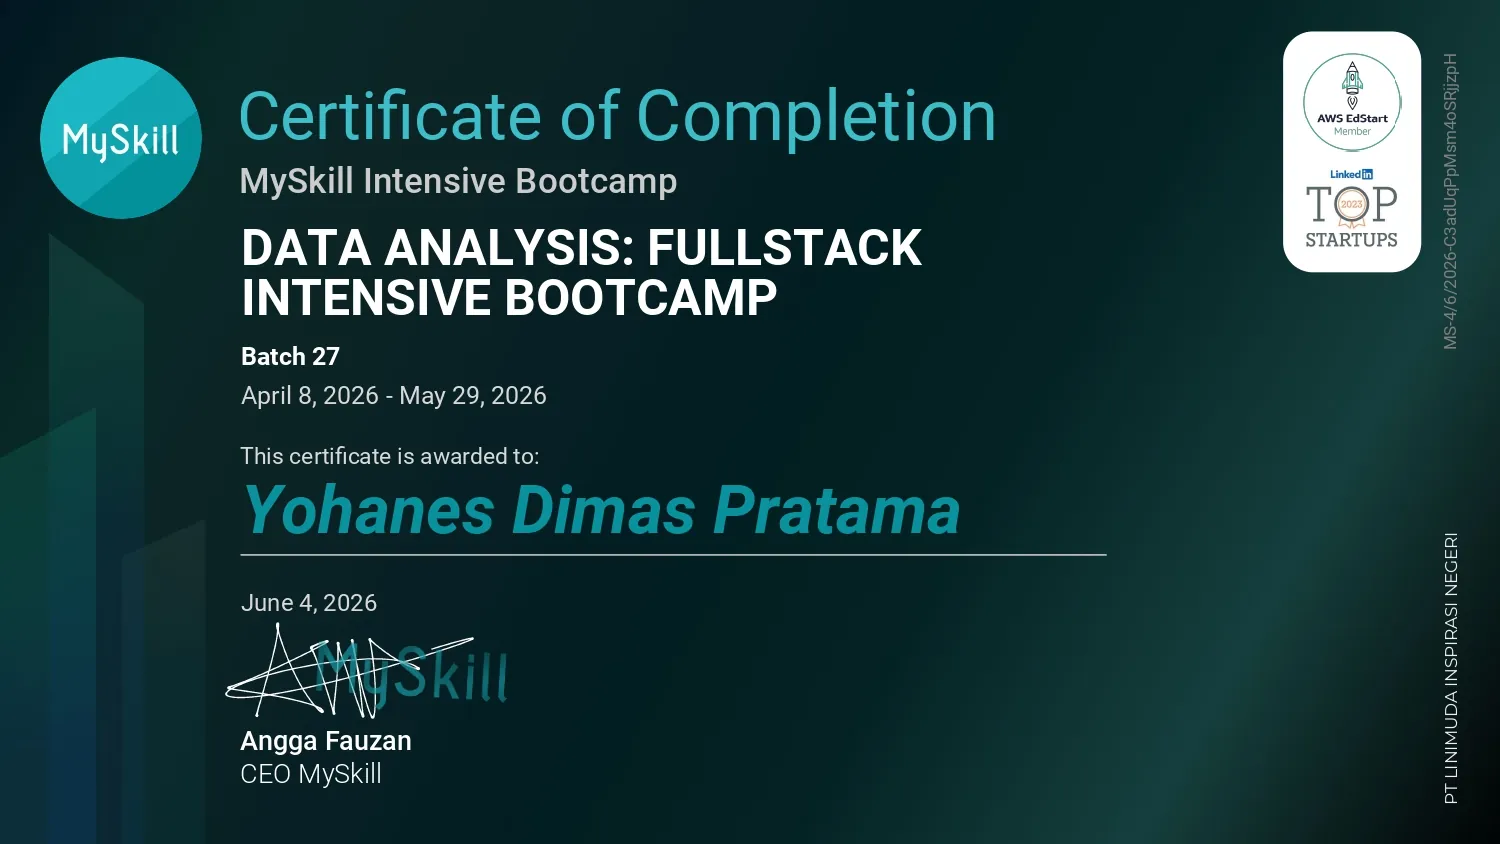
Data Analysis: Fullstack Intensive Bootcamp is a MySkill credential dated May 2026 covering an end-to-end path for analytical work. Modules introduce the analyst's role, statistics, problem solving, and data formatting and validation before moving into SQL basics, business-data analysis, SQL interview cases, Python-based analysis, and visualization. The curriculum connects framing a question and preparing data with querying, analyzing, and communicating findings; the source does not identify a dataset, project, or measured result.
This credential is officially authenticated by the issuing platform. You can verify the public records and cryptographic validity directly.
Kickstart Career as Data Analysis
Introduces career paths and responsibilities related to data analysis. The discussion relates analytical questions, data quality, and clear communication to the role.
Intro to Data Analysis
Covers the basic process of examining data to answer questions. A typical analysis starts with a question, checks data quality, and selects a suitable summary.
Basic Statistic
Introduces statistical measures for describing and interpreting data. Center and spread describe different aspects of a dataset and can expose misleading averages.
Introduction to Problem Solving
Covers defining a problem before choosing an analytical approach. A precise question helps identify which data and assumptions are relevant before selecting a method.
Data Formatting dan Validation
Addresses formatting data and validating entries before analysis. Consistent types and checks for missing or invalid entries reduce errors in downstream queries.
SQL Basic: Basic Clause
Introduces SQL clauses for selecting and filtering database records. SELECT, WHERE, and related clauses define which columns and rows a query returns.
SQL Basic: Analyzing Business Data
Covers using basic SQL queries to examine business data. Filtering and grouping records can turn transaction-level data into a business-oriented summary.
SQL For Data Analysis
Explores SQL queries for extracting and summarizing analytical data. Joins and aggregations help connect records and calculate results across related tables.
SQL Technical Interview Case Studies
Covers reasoning through SQL problems in technical interview scenarios. Explaining assumptions and validating query output matters as much as writing syntactically valid SQL.
Data Analysis with Python
Introduces using Python to inspect and analyze datasets. Data can be loaded, inspected, cleaned, and summarized programmatically before visualization.
Data Visualization
Covers using visual representations to communicate analytical findings. Chart type, scale, and labels should make a comparison clear without overstating the evidence.