Forecasting, Regression and Statistic in Excel
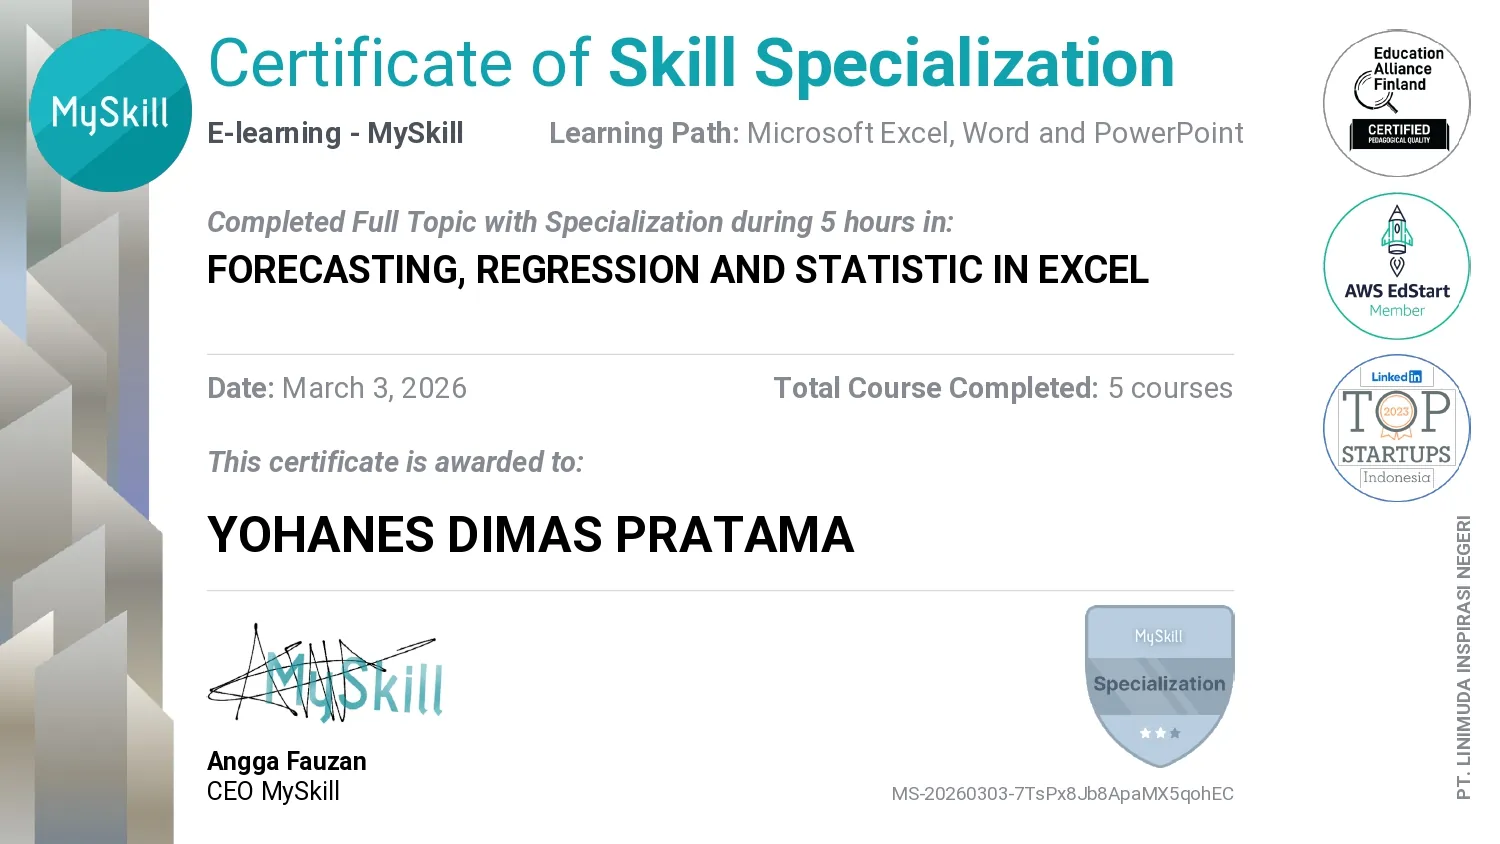
Forecasting, Regression and Statistic in Excel is a MySkill credential dated March 2026 focused on quantitative analysis within spreadsheets. The documented topics start with descriptive statistics and an introduction to statistical reasoning, then cover time-series analysis, linear regression, and forecasting from time-based observations. This scope distinguishes summarizing existing values from examining relationships and estimating future values; the source does not provide a forecasting model, dataset, or accuracy result.
This credential is officially authenticated by the issuing platform. You can verify the public records and cryptographic validity directly.
Time Series Analysis
Introduces observations arranged over time and their patterns. A trend, seasonal variation, or unusual observation can each change how a series is interpreted.
Linear Regression
Covers modeling a relationship between variables with a linear trend. The fitted line describes an association; its slope and residuals help assess whether it explains the observations.
Forecasting Time Series
Addresses using time-based observations to estimate future values. Forecasts depend on historical patterns and assumptions, so uncertainty matters alongside a projected value.
Introduction to Statistic
Introduces statistical concepts used to interpret data. It distinguishes a population from a sample and a summary measure from an inference about unseen data.
Descriptive Statistic in Excel
Covers summarizing distributions with descriptive measures in Excel. Measures such as central tendency and spread reveal more than a total or a single average.