Diabetes Classification Using KNN with Data Normalization
PROJECT OVERVIEW & OPERATIONAL CONTEXT
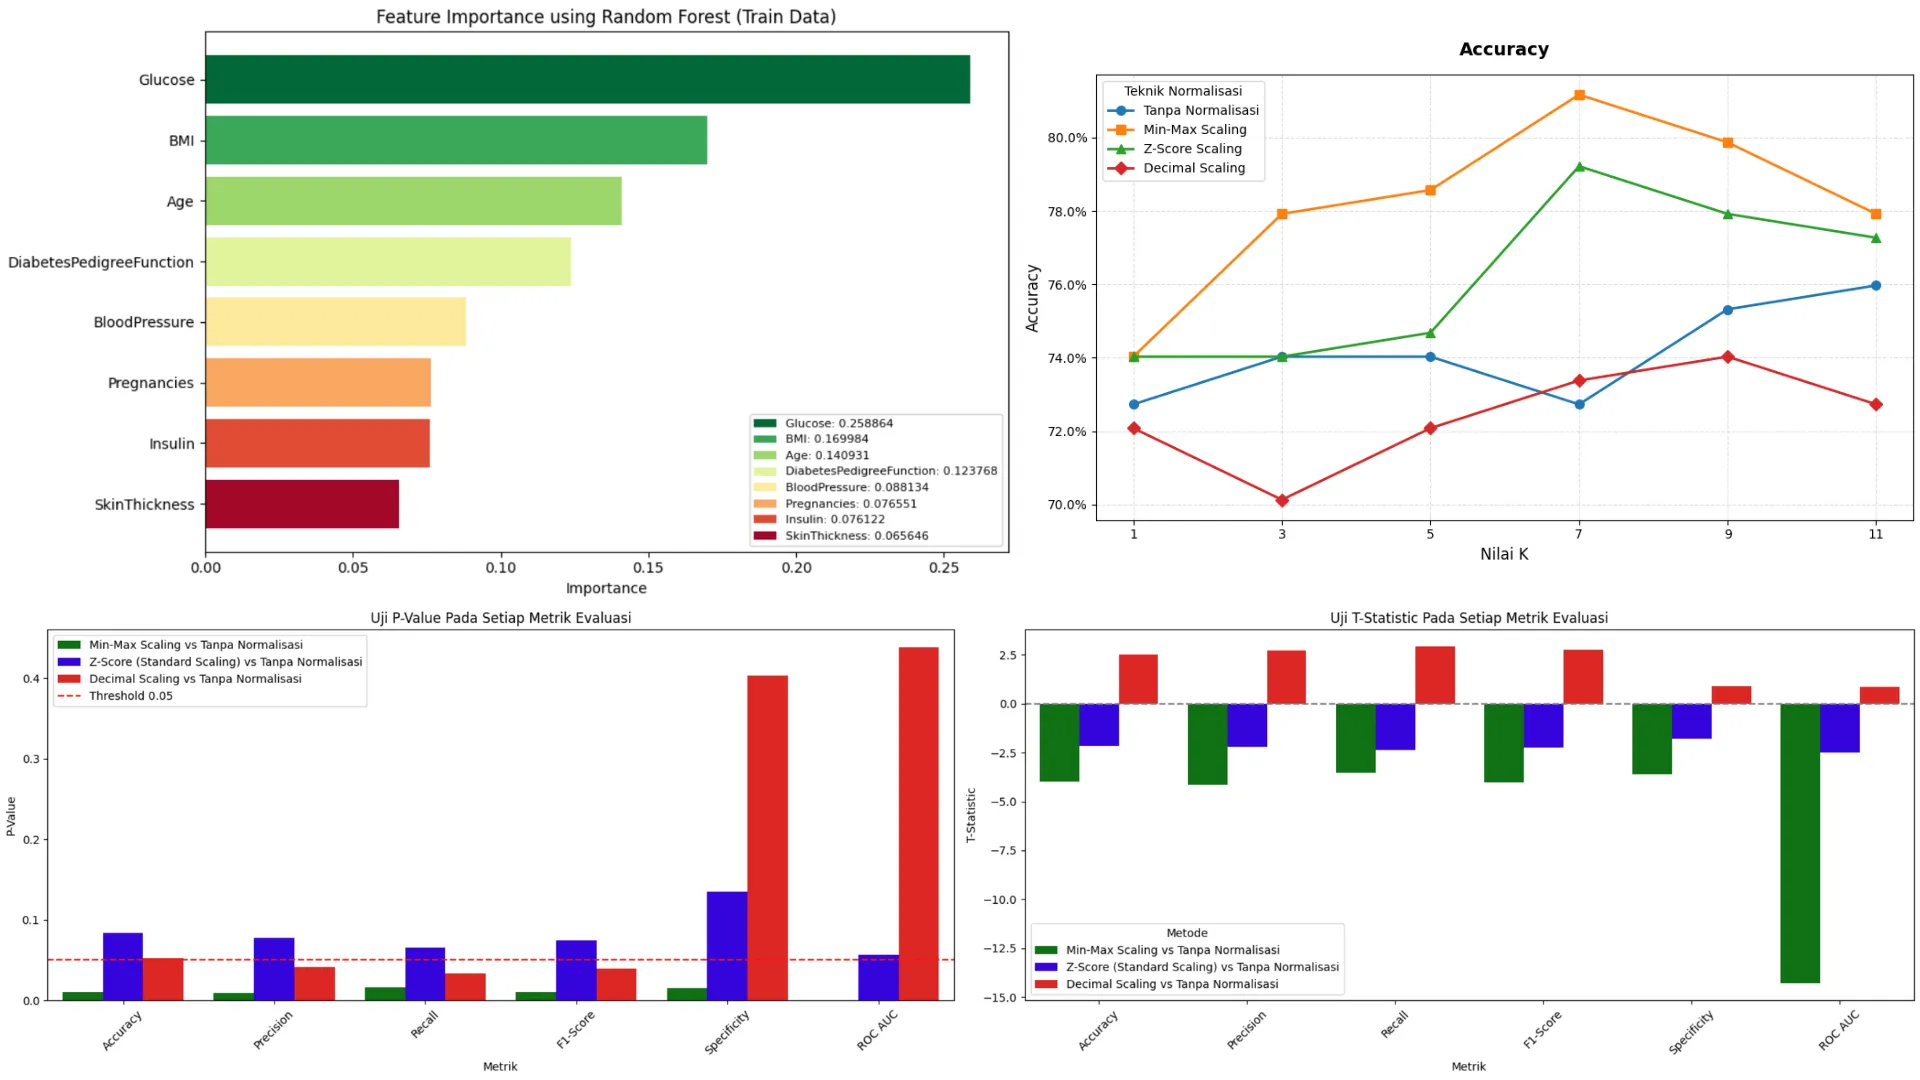
Diabetes Classification Using KNN with Data Normalization is an empirical machine learning research project engineered to resolve distance metric sensitivity and magnitude distortions in non-parametric clinical diagnostic systems. In instance-based algorithms such as K-Nearest Neighbors (K-NN), high-magnitude physiological attributes like glucose and insulin overpower smaller continuous markers in Euclidean distance calculations, biasing nearest-neighbor queries. To solve this, the pipeline combines tree-based Gini feature importance pruning via a 100-estimator Random Forest—isolating the four primary diagnostic predictors: Glucose, BMI, Age, and DiabetesPedigreeFunction—with four data transformation paradigms: Min-Max Scaling, Z-Score Standardization, Decimal Scaling, and raw feature baselines. Evaluated across neighborhood parameters k from 1 to 11 on the Pima Indians Diabetes Database, the architecture undergoes two-tailed paired Student's t-tests, proving that Min-Max Scaling delivers statistically significant diagnostic improvements (81.17% accuracy, 84.85% specificity, and p = 0.00003 for ROC AUC) while decimal scaling severely degrades classification stability.
PROBLEM STATEMENT & SYSTEM CONSTRAINTS
Disparate physiological measurement ranges between serum glucose (up to 199 mg/dL) and continuous genetic indicators like diabetes pedigree function (spanning 0.078 to 2.42) caused high-magnitude features to dominate Euclidean distance summations by multiple orders of magnitude. This masked subtle metabolic signals in unscaled K-NN neighbor queries. Additionally, non-normal biomarker distributions and varying compression bounds in naive scaling methods introduced decision-boundary instability, risking severe misclassifications in clinical diagnostic screening.
- Automate the binary classification of clinical patient records into diabetic ('Outcome = 1') and non-diabetic ('Outcome = 0') cases using non-parametric instance-based learning.
- Mitigate feature magnitude dominance in Euclidean distance calculations by evaluating bounded, standardized, and logarithmic normalization techniques.
- Prune noisy and redundant clinical biometric indicators using Random Forest Mean Decrease in Impurity (MDI) to isolate the top predictive biomarkers.
- Systematically optimize neighborhood hyperparameter k across odd integer intervals (k in {1, 3, 5, 7, 9, 11}) to maximize discriminative classification boundaries.
- Statistically validate diagnostic performance alterations using two-tailed paired Student's t-tests (alpha = 0.05) across six comprehensive clinical evaluation metrics.
Random Forest MDI Feature Selection
Calculates Mean Decrease in Impurity across 100 decision trees to prune low-contributing biometric indicators and isolate the top four clinical predictive features.
Bounded Min-Max Normalization Engine
Rescales selected clinical biomarkers into a strictly bounded zero-to-one interval, preventing magnitude-dominant features from distorting Euclidean neighbor calculations.
Z-Score Variance Standardization
Transforms physiological distributions to zero empirical mean and unit variance, preserving distribution profiles while scaling variables for distance-based evaluation.
Vectorized Decimal Normalization
Applies custom logarithmic power-of-ten divisors based on feature absolute maximums to evaluate non-bounded origin-preserving compression in distance spaces.
Multi-Neighborhood K-NN Classifier
Fits non-parametric instance-based classifiers across odd neighborhood values from k equals 1 to 11 to eliminate voting ties and maximize decision margin.
Paired Student's T-Test Engine
Executes two-tailed paired t-tests across neighborhood runs to determine empirical statistical significance against unscaled clinical baselines at alpha equals 0.05.
Random Forest Gini feature importance pruning + Quad-method data normalization engine + Parametric K-NN hyperparameter search + Paired Student's t-test hypothesis validation
Tabular Clinical Ingestion & Audit
Load 768 patient records from the Pima Indians Diabetes Database, inspect column data types, verify zero missing values, and analyze biometric value distributions.
Stratified Train-Test Holdout Partitioning
Split raw observations into an 80% training set (614 samples) and a 20% holdout test set (154 samples) with fixed random seed 42 to prevent data leakage.
Random Forest Gini Feature Pruning
Train a 100-estimator RandomForestClassifier on training data to compute Gini feature importance, selecting Glucose, BMI, Age, and DPF while dropping 4 redundant features.
Normalization Matrix Transformation
Fit scaler parameters strictly on selected training features and transform both training and testing matrices to generate normalized feature tensors.
Instance-Based K-NN Distance Computation
Compute pairwise Euclidean distances between test queries and training vectors across neighborhood sizes k in {1, 3, 5, 7, 9, 11} to generate binary class predictions.
Multi-Metric Diagnostic Telemetry
Compute confusion matrices, macro-averaged Accuracy, Precision, Recall, Specificity, F1-Score, and ROC AUC trajectories across all experimental branches.
Paired Hypothesis Significance Testing
Execute paired two-tailed Student's t-tests comparing each scaling pipeline against unnormalized baseline metrics across degrees of freedom df = 5.
SYSTEM EVALUATION & EMPIRICAL VALIDATION
VERIFIED_TELEMETRYAcross extensive empirical evaluations on the 154-sample Pima Indians holdout test partition, Min-Max Scaling with neighborhood parameter k = 7 demonstrated decisive superiority, achieving peak scores of 81.17% Accuracy, 79.46% Precision, 79.70% Recall, 79.58% F1-Score, 84.85% Specificity, and 79.50% ROC AUC. Two-tailed paired Student's t-tests confirmed that Min-Max Scaling produced statistically significant diagnostic improvements over the unnormalized baseline across all six evaluated metrics, with t = -3.998 (p = 0.01035) for Accuracy, t = -4.021 (p = 0.01011) for F1-Score, and t = -14.305 (p = 0.00003) for ROC AUC at an alpha = 0.05 threshold. While Z-Score standardization yielded positive directional gains peaking at 79.22% accuracy and 81.29% ROC AUC (k = 11), its margin over raw features remained statistically non-significant (p = 0.0836 for accuracy). Conversely, Decimal Scaling failed to improve upon the unscaled baseline, achieving a maximum accuracy of only 74.03% (k = 9) while exhibiting statistically significant performance degradation across Precision (t = +2.733, p = 0.0411), Recall (t = +2.925, p = 0.0328), and F1-Score (t = +2.780, p = 0.0389). On standard workstation CPU hardware, end-to-end single-instance distance inference executed in under 0.5ms, demonstrating a computationally lightweight, highly calibrated diagnostic screening system.
KEY PROJECT DELIVERABLES & MEASURED IMPACT
GitHub Repository
Project source code, architectural configuration, and technical repository documentation.
Technical Documentation & Spec
Primary architectural specification: PRO-22 // AI-04 (Python, scikit-learn, SciPy, Pandas).
Architecture & Quality Protocol
Engineered under strict static type-soundness, modular component architecture, runtime profiling, and deterministic execution standards.
CPP Learning Modules
Comprehensive C++20 educational curriculum comprising 17 modular pedagogical stages and 250 standalone compilable programs, delivering hands-on mastery of systems programming, memory architecture, RAII smart pointers, OOP design patterns, STL algorithms, and real-world terminal capstones.
Poliklinik Udinus
Full-stack campus healthcare management and outpatient booking platform built with native PHP 8.2, MySQL, and Bootstrap 5, featuring multi-role RBAC, dynamic AJAX doctor schedule resolution, automated Medical Record Number generation, shift collision prevention, and prescription billing computation.